YouTube Data Analysis Project
Project Overview
This project is based on the YouTube Trending Videos dataset from Kaggle. The dataset contains over 40,000+ video records across multiple countries including US, GB, CA, and more. The raw data file is approximately 50MB and includes features such as video title, views, likes, dislikes, comments, tags, and publish dates.
In the initial phase, I conducted thorough data cleaning and preparation using Power Query:
- Removed duplicate records based on video ID and publish time
- Replaced nulls and corrected formatting issues in numeric and date fields
- Standardized category naming and encoded categorical values
- Filtered irrelevant columns to optimize performance
Once cleaned, I built relationships between tables, calculated new fields using DAX, and designed an interactive dashboard that highlights trends and key engagement metrics.
Tools Used
- Power BI (Data modeling, DAX, dashboard creation)
- Power Query (Data cleaning and transformation)
- Kaggle Dataset: YouTube Trending Videos
Key KPIs Displayed
Top Trending Video Categories
Most Popular Channels by Views
Likes vs Dislikes Ratio
Comment Activity per Category
Video Publish Day vs Performance
Dashboard Snapshots
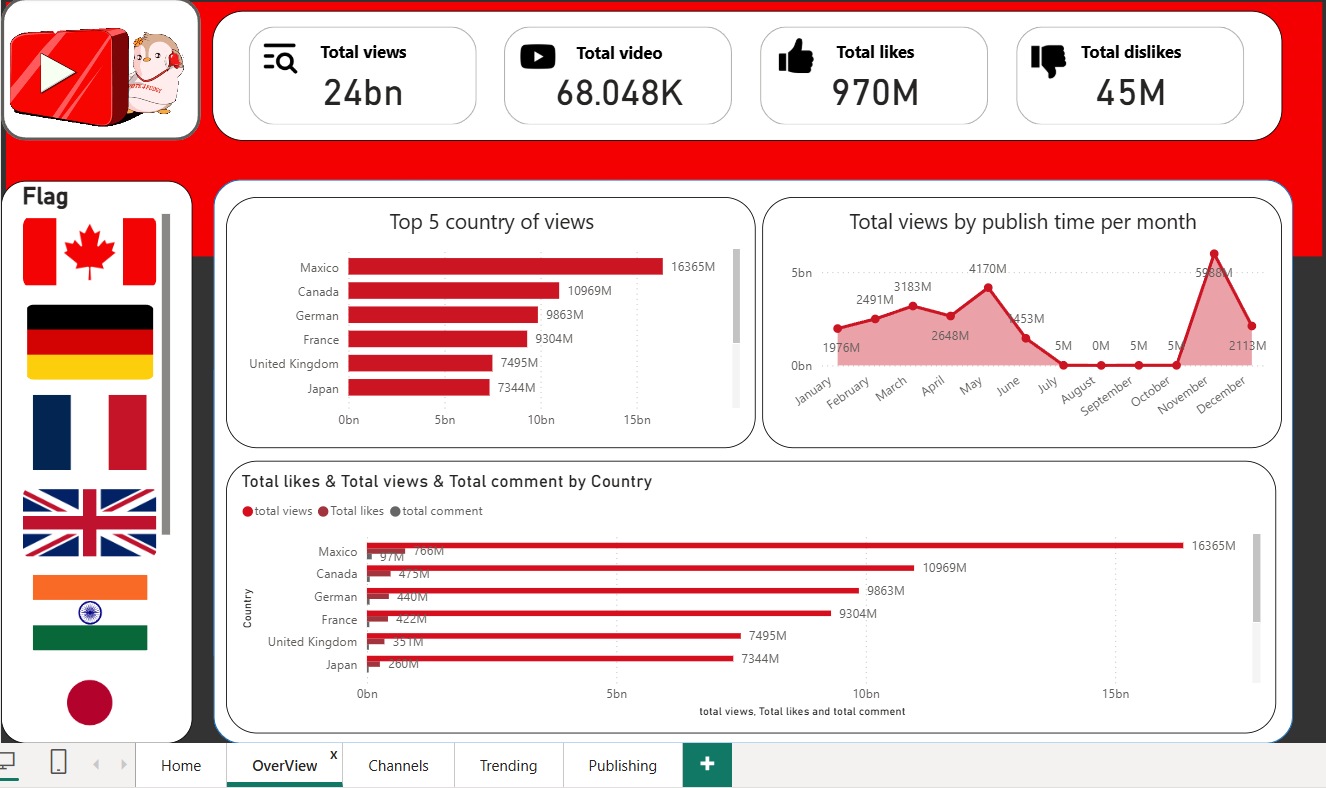
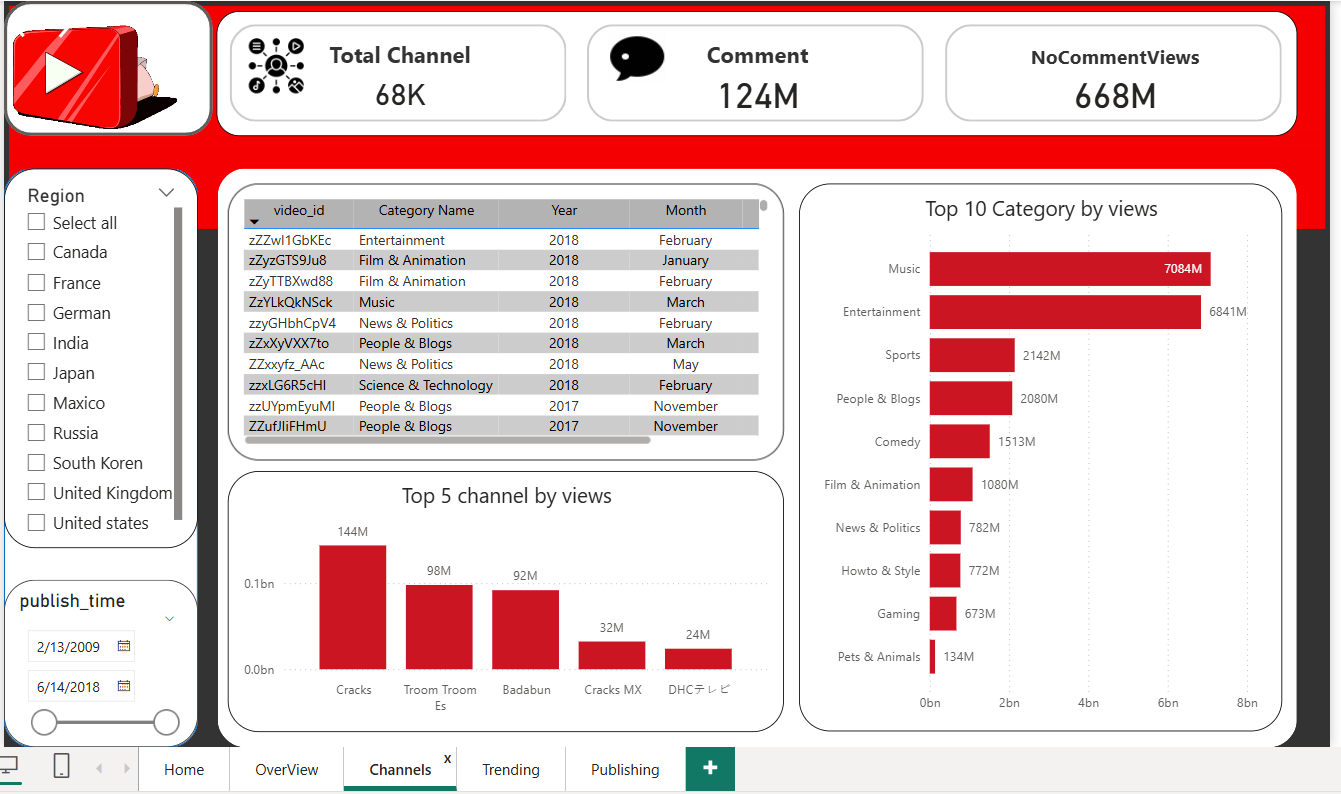
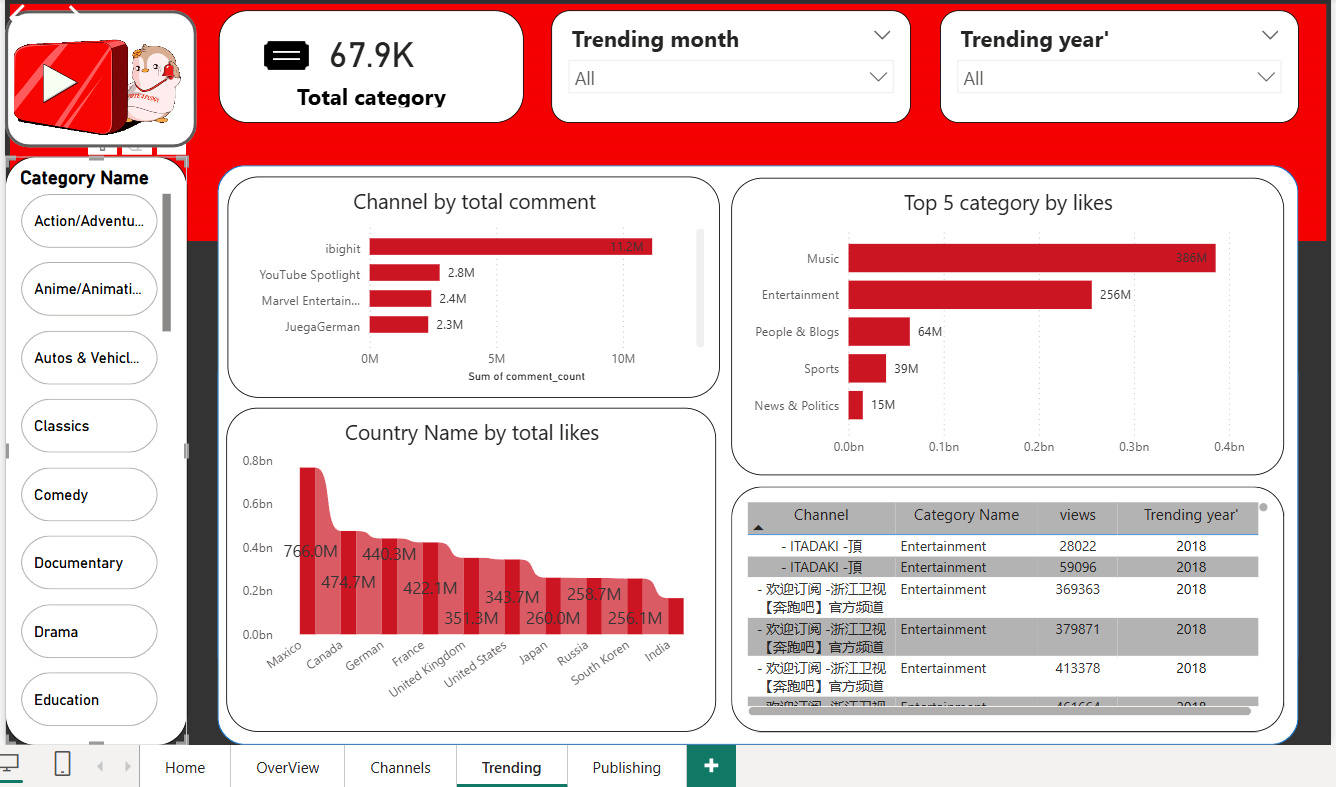
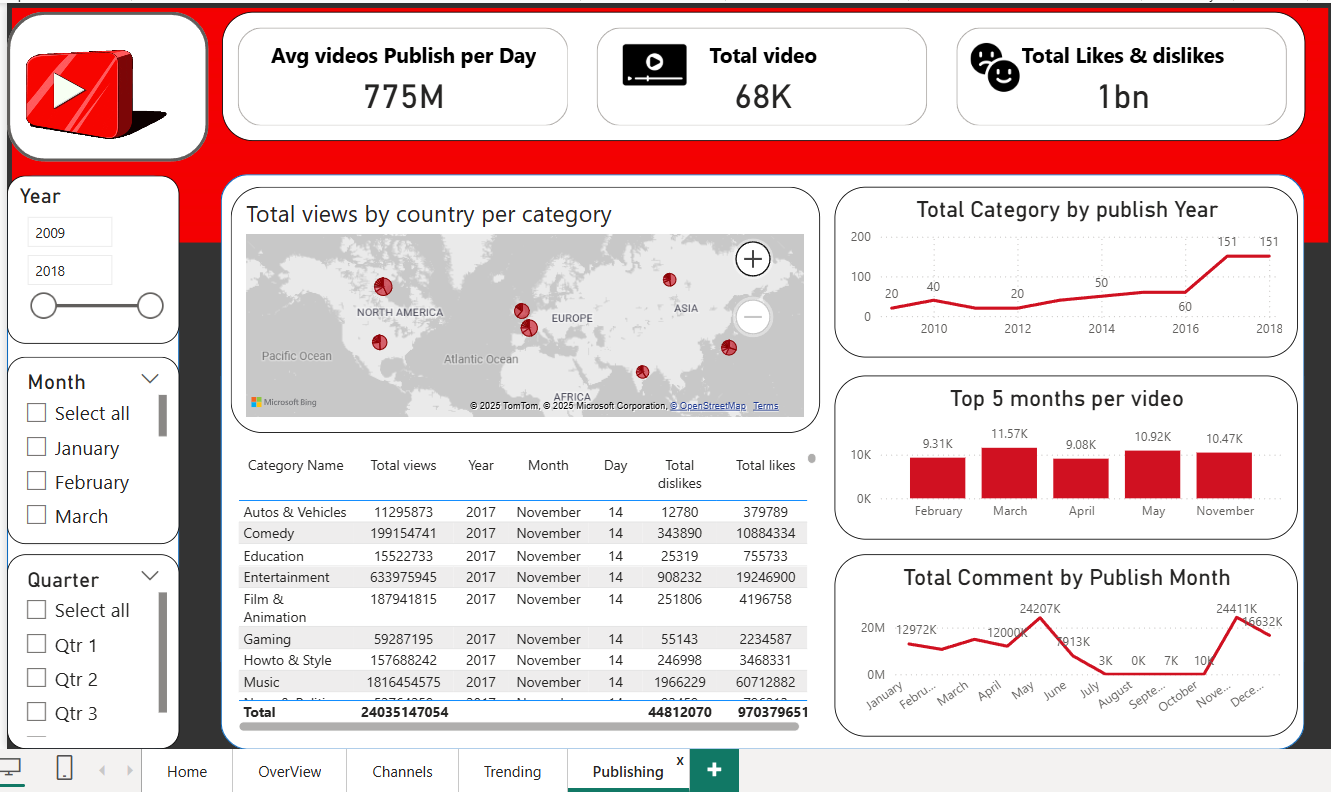
Note: All insights were derived by cleaning the dataset, identifying duplicates,
standardizing fields, and applying calculated measures in Power BI. Visuals are designed for clarity and
high-level decision-making.